
Investors
Number of stores / Sales amount
Number of stores by prefecture in Japan


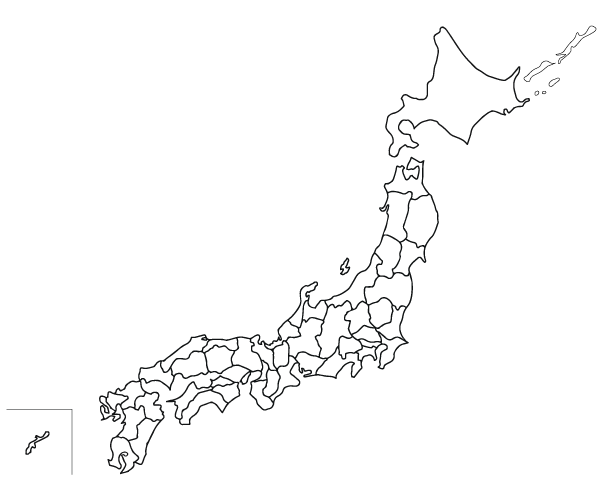
- Hokkaido / Tohoku
- Hokkaido: 0
- Aomori: 1
- Iwate: 0
- Miyagi: 0
- Akita: 0
- Yamagata: 0
- Fukushima: 0
- Total: 1
- Kanto
- Tokyo: 24
- Kanagawa: 2
- Saitama: 1
- Chiba: 3
- Gunma: 0
- Tochigi: 0
- Ibaraki: 0
- Total: 30
- Chubu
- Niigata: 0
- Toyama: 1
- Ishikawa: 0
- Fukui: 0
- Yamanashi: 0
- Nagano: 0
- Gifu: 1
- Shizuoka: 0
- Aichi: 7
- Mie: 3
- Total: 12
- Kinki
- Hyogo: 3
- Osaka: 14
- Nara: 6
- Kyoto: 0
- Wakayama: 0
- Shiga: 0
- Total: 23
- Chugoku
- Okayama: 10
- Hiroshima: 14
- Yamaguchi: 37
- Tottori: 2
- Shimane: 0
- Total: 63
- Shikoku
- Kagawa: 14
- Ehime: 13
- Tokushima: 2
- Kouchi: 0
- Total: 29
- Kyushu
- Fukuoka: 198
- Saga: 20
- Nagasaki: 11
- Kumamoto: 62
- Oita: 27
- Miyazaki: 53
- Kagoshima: 36
- Okinawa: 1
- Total:408
Historical number of stores and year-on-year rate of sales amount
FY December 2026 (26th period: Jan. 1 - Dec 31, 2026)
| Month | Number of stores | |||
|---|---|---|---|---|
| Newly-opened | Relocated | Closed | Cumulative total | |
| Jan, 2026 | 0 | 0 | 0 | 571 |
| Feb, 2026 | 1 | 0 | 0 | 572 |
| Mar, 2026 | 1 | 0 | 4 | 569 |
| Apr, 2026 | 0 | 0 | 0 | 569 |
| May, 2026 | 0 | 0 | 2 | 567 |
| June, 2026 | 0 | 0 | 1 | 566 |
| July, 2026 | ||||
| Aug, 2026 | ||||
| Sept, 2026 | ||||
| Oct, 2026 | ||||
| Nov, 2026 | ||||
| Dec, 2026 | ||||
Year-on-year rate of sales amount
2026年12月期(26期 2026年1月1日~2026年12月31日)
| Month | Year-on-year rate of sales amount(%) | |
|---|---|---|
| All stores | Existing stores | |
| Jan, 2026 | 92.6% | 93.5% |
| Feb, 2026 | 90.0% | 93.0% |
| Mar, 2026 | 81.1% | 81.8% |
| Apr, 2026 | 104.2% | 109.3% |
| May, 2026 | 94.5% | 99.4% |
| June, 2026 | 85.0% | 89.7% |
| July, 2026 | ||
| Aug, 2026 | ||
| Sept, 2026 | ||
| Oct, 2026 | ||
| Nov, 2026 | ||
| Dec, 2026 | ||
FY December 2025 (25th period: Jan. 1 - Dec 31, 2025)
| Month | Number of stores | |||
|---|---|---|---|---|
| Newly-opened | Relocated | Closed | Cumulative total | |
| Jan, 2025 | 0 | 0 | 1 | 582 |
| Feb, 2025 | 0 | 0 | 2 | 580 |
| Mar, 2025 | 1 | 0 | 0 | 581 |
| Apr, 2025 | 0 | 0 | 4 | 577 |
| May, 2025 | 1 | 0 | 1 | 577 |
| June, 2025 | 1 | 0 | 2 | 576 |
| July, 2025 | 0 | 0 | 1 | 575 |
| Aug, 2025 | 1 | 0 | 1 | 575 |
| Sept, 2025 | 1 | 0 | 4 | 572 |
| Oct, 2025 | 1 | 0 | 2 | 571 |
| Nov, 2025 | 0 | 0 | 1 | 570 |
| Dec, 2025 | 1 | 0 | 0 | 571 |
Year-on-year rate of sales amount
2025年12月期(25期 2025年1月1日~2025年12月31日)
| Month | Year-on-year rate of sales amount(%) | |
|---|---|---|
| All stores | Existing stores | |
| Jan, 2025 | 89.9% | 91.8% |
| Feb, 2025 | 79.0% | 80.7% |
| Mar, 2025 | 100.0% | 102.3% |
| Apr, 2025 | 81.4% | 83.1% |
| May, 2025 | 107.3% | 109.4% |
| June, 2025 | 102.0% | 103.6% |
| July, 2025 | 68.9% | 70.1% |
| Aug, 2025 | 110.1% | 106.9% |
| Sept, 2025 | 111.4% | 113.5% |
| Oct, 2025 | 94.5% | 96.3% |
| Nov, 2025 | 85.5% | 86.6% |
| Dec, 2025 | 91.7% | 89.8% |
FY December 2024 (24th period: Jan. 1 - Dec 31, 2024)
| Month | Number of stores | |||
|---|---|---|---|---|
| Newly-opened | Relocated | Closed | Cumulative total | |
| Jan, 2024 | 1 | 0 | 2 | 596 |
| Feb, 2024 | 0 | 0 | 1 | 595 |
| Mar, 2024 | 0 | 0 | 1 | 594 |
| Apr, 2024 | 2 | 0 | 4 | 592 |
| May, 2024 | 0 | 0 | 4 | 588 |
| June, 2024 | 1 | 0 | 1 | 588 |
| July, 2024 | 0 | 0 | 3 | 585 |
| Aug, 2024 | 1 | 0 | 2 | 584 |
| Sept, 2024 | 0 | 0 | 0 | 584 |
| Oct, 2024 | 0 | 0 | 3 | 581 |
| Nov, 2024 | 0 | 0 | 1 | 580 |
| Dec, 2024 | 4 | 0 | 1 | 583 |
Year-on-year rate of sales amount
2024年12月期(24期 2024年1月1日~2024年12月31日)
| Month | Year-on-year rate of sales amount(%) | |
|---|---|---|
| All stores | Existing stores | |
| Jan, 2024 | 94.3% | 96.0% |
| Feb, 2024 | 118.5% | 120.6% |
| Mar, 2024 | 107.5% | 109.3% |
| Apr, 2024 | 111.4% | 113.2% |
| May, 2024 | 85.0% | 86.1% |
| June, 2024 | 101.7% | 104.1% |
| July, 2024 | 97.8% | 99.9% |
| Aug, 2024 | 84.9% | 87.0% |
| Sept, 2024 | 86.0% | 88.3% |
| Oct, 2024 | 102.9% | 105.1% |
| Nov, 2024 | 119.6% | 121.9% |
| Dec, 2024 | 91.8% | 93.2% |
FY December 2023 (23th period: Jan. 1 - Dec 31, 2023)
| Month | Number of stores | |||
|---|---|---|---|---|
| Newly-opened | Relocated | Closed | Cumulative total | |
| Jan, 2023 | 0 | 0 | 3 | 611 |
| Feb, 2023 | 0 | 0 | 1 | 610 |
| Mar, 2023 | 1 | 0 | 1 | 610 |
| Apr, 2023 | 0 | 0 | 2 | 608 |
| May, 2023 | 0 | 0 | 0 | 608 |
| June, 2023 | 0 | 0 | 0 | 608 |
| July, 2023 | 0 | 0 | 3 | 605 |
| Aug, 2023 | 0 | 0 | 0 | 605 |
| Sept, 2023 | 0 | 0 | 3 | 602 |
| Oct, 2023 | 0 | 0 | 5 | 597 |
| Nov, 2023 | 0 | 0 | 1 | 596 |
| Dec, 2023 | 1 | 0 | 0 | 597 |
Year-on-year rate of sales amount
2023年12月期(23期 2023年1月1日~2023年12月31日)
| Month | Year-on-year rate of sales amount(%) | |
|---|---|---|
| All stores | Existing stores | |
| Jan, 2023 | 111.8% | 113.8% |
| Feb, 2023 | 109.7% | 112.4% |
| Mar, 2023 | 107.9% | 110.8% |
| Apr, 2023 | 104.4% | 107.1% |
| May, 2023 | 108.6% | 111.7% |
| June, 2023 | 112.4% | 115.4% |
| July, 2023 | 118.1% | 122.4% |
| Aug, 2023 | 106.8% | 108.4% |
| Sept, 2023 | 89.7% | 91.1% |
| Oct, 2023 | 99.3% | 101.2% |
| Nov, 2023 | 105.2% | 107.8% |
| Dec, 2023 | 98.2% | 100.5% |
FY December 2022 (22th period: Jan. 1 - Dec 31, 2022)
| Month | Number of stores | |||
|---|---|---|---|---|
| Newly-opened | Relocated | Closed | Cumulative total | |
| Jan, 2022 | 0 | 0 | 2 | 631 |
| Feb, 2022 | 1 | 0 | 1 | 631 |
| Mar, 2022 | 3 | 0 | 5 | 629 |
| Apr, 2022 | 0 | (1) | 2 | 626 |
| May, 2022 | 0 | 0 | 4 | 622 |
| June, 2022 | 1 | 0 | 0 | 623 |
| July, 2022 | 0 | 1 | 3 | 621 |
| Aug, 2022 | 0 | 0 | 1 | 620 |
| Sept, 2022 | 0 | 0 | 2 | 618 |
| Oct, 2022 | 0 | 0 | 0 | 618 |
| Nov, 2022 | 0 | 0 | 1 | 617 |
| Dec, 2022 | 1 | 0 | 4 | 614 |
Year-on-year rate of sales amount
2022年12月期(22期 2022年1月1日~2022年12月31日)
| Month | Year-on-year rate of sales amount(%) | |
|---|---|---|
| All stores | Existing stores | |
| Jan, 2022 | 94.5% | 93.8% |
| Feb, 2022 | 107.1% | 106.4% |
| Mar, 2022 | 95.5% | 95.0% |
| Apr, 2022 | 107.7% | 108.2% |
| May, 2022 | 80.4% | 81.3% |
| June, 2022 | 99.2% | 100.1% |
| July, 2022 | 92.3% | 93.3% |
| Aug, 2022 | 68.6% | 69.6% |
| Sept, 2022 | 99.2% | 100.8% |
| Oct, 2022 | 101.1% | 102.9% |
| Nov, 2022 | 91.9% | 93.4% |
| Dec, 2022 | 109.6% | 111.3% |
FY December 2021 (21th period: Jan. 1 - Dec 31, 2021)
| Month | Number of stores | |||
|---|---|---|---|---|
| Newly-opened | Relocated | Closed | Cumulative total | |
| Jan, 2021 | 1 | 0 | 2 | 632 |
| Feb, 2021 | 3 | 0 | 1 | 634 |
| Mar, 2021 | 1 | 0 | 3 | 632 |
| Apr, 2021 | 2 | 0 | 0 | 634 |
| May, 2021 | 1 | 0 | 1 | 634 |
| June, 2021 | 1 | 0 | 1 | 634 |
| July, 2021 | 2 | 0 | 1 | 635 |
| Aug, 2021 | 0 | 0 | 2 | 633 |
| Sept, 2021 | 2 | 0 | 1 | 634 |
| Oct, 2021 | 0 | 0 | 1 | 633 |
| Nov, 2021 | 1 | 0 | 1 | 633 |
| Dec, 2021 | 5 | 0 | 5 | 633 |
Year-on-year rate of sales amount
2021年12月期(21期 2021年1月1日~2021年12月31日)
| Month | Year-on-year rate of sales amount(%) | |
|---|---|---|
| All stores | Existing stores | |
| Jan, 2021 | 92.7% | 90.1% |
| Feb, 2021 | 81.5% | 79.3% |
| Mar, 2021 | 97.8% | 95.6% |
| Apr, 2021 | 119.5% | 117.3% |
| May, 2021 | 124.9% | 122.4% |
| June, 2021 | 91.8% | 89.9% |
| July, 2021 | 75.5% | 73.7% |
| Aug, 2021 | 154.9% | 151.4% |
| Sept, 2021 | 94.1% | 92.3% |
| Oct, 2021 | 104.3% | 102.2% |
| Nov, 2021 | 107.3% | 106.6% |
| Dec, 2021 | 105.5% | 104.5% |
FY December 2020 (20th period: Jan. 1 - Dec 31, 2020)
| Month | Number of stores | |||
|---|---|---|---|---|
| Newly-opened | Relocated | Closed | Cumulative total | |
| Jan, 2020 | 1 | 0 | 0 | 619 |
| Feb, 2020 | 4 | 0 | 0 | 623 |
| Mar, 2020 | 4 | 0 | 0 | 627 |
| Apr, 2020 | 0 | 0 | 1 | 626 |
| May, 2020 | 0 | 0 | 1 | 625 |
| June, 2020 | 2 | 0 | 0 | 627 |
| July, 2020 | 1 | 0 | 7 | 621 |
| Aug, 2020 | 4 | 0 | 0 | 625 |
| Sept, 2020 | 2 | 0 | 2 | 625 |
| Oct, 2020 | 11 | 0 | 3 | 633 |
| Nov, 2020 | 0 | 0 | 1 | 632 |
| Dec, 2020 | 2 | 0 | 1 | 633 |
Year-on-year rate of sales amount
2020年12月期(20期 2020年1月1日~2020年12月31日)
| Month | Year-on-year rate of sales amount(%) | |
|---|---|---|
| All stores | Existing stores | |
| Jan, 2020 | 127.2% | 118.9% |
| Feb, 2020 | 112.7% | 108.7% |
| Mar, 2020 | 105.7% | 101.7% |
| Apr, 2020 | 83.2% | 79.8% |
| May, 2020 | 103.9% | 100.3% |
| June, 2020 | 114.8% | 111.8% |
| July, 2020 | 114.1% | 110.9% |
| Aug, 2020 | 73.5% | 71.7% |
| Sept, 2020 | 104.4% | 101.7% |
| Oct, 2020 | 93.3% | 90.9% |
| Nov, 2020 | 91.9% | 88.9% |
| Dec, 2020 | 83.9% | 81.8% |
FY December 2019 (19th period: Jan. 1 - Dec 31, 2019)
| Month | Number of stores | |||
|---|---|---|---|---|
| Newly-opened | Relocated | Closed | Cumulative total | |
| Jan, 2019 | 1 | 0 | 0 | 584 |
| Feb, 2019 | 1 | 0 | 0 | 585 |
| Mar, 2019 | 5 | 0 | 1 | 589 |
| Apr, 2019 | 4 | 0 | 0 | 593 |
| May, 2019 | 4 | 0 | 0 | 597 |
| June, 2019 | 4 | 0 | 0 | 601 |
| July, 2019 | 2 | 0 | 1 | 602 |
| Aug, 2019 | 2 | 0 | 0 | 604 |
| Sept, 2019 | 3 | 0 | 0 | 607 |
| Oct, 2019 | 2 | 0 | 0 | 609 |
| Nov, 2019 | 5 | 0 | 1 | 613 |
| Dec, 2019 | 5 | 0 | 0 | 618 |
Year-on-year rate of sales amount
2019年12月期(19期 2019年1月1日~2019年12月31日)
| Month | Year-on-year rate of sales amount(%) | |
|---|---|---|
| All stores | Existing stores | |
| Jan, 2019 | 97.8% | 87.4% |
| Feb, 2019 | 110.2% | 99.9% |
| Mar, 2019 | 113.9% | 103.1% |
| Apr, 2019 | 119.6% | 108.0% |
| May, 2019 | 108.9% | 98.2% |
| June, 2019 | 102.9% | 93.2% |
| July, 2019 | 134.2% | 122.7% |
| Aug, 2019 | 172.5% | 164.1% |
| Sept, 2019 | 97.0% | 91.7% |
| Oct, 2019 | 112.8% | 104.0% |
| Nov, 2019 | 122.3% | 113.9% |
| Dec, 2019 | 103.1% | 96.4% |
FY December 2018 (18th period: Jan. 1 - Dec 31, 2018)
| Month | Number of stores | |||
|---|---|---|---|---|
| Newly-opened | Relocated | Closed | Cumulative total | |
| Jan, 2018 | 3 | 0 | 0 | 497 |
| Feb, 2018 | 7 | (1) | 0 | 503 |
| Mar, 2018 | 3 | 0 | 0 | 506 |
| Apr, 2018 | 2 | 0 | 1 | 507 |
| May, 2018 | 7 | 1 | 0 | 515 |
| June, 2018 | 13 | 0 | 0 | 528 |
| July, 2018 | 5 | 0 | 0 | 533 |
| Aug, 2018 | 4 | 0 | 0 | 537 |
| Sept, 2018 | 6 | 0 | 0 | 543 |
| Oct, 2018 | 6 | 0 | 0 | 549 |
| Nov, 2018 | 5 | 0 | 0 | 554 |
| Dec, 2018 | 29 | 0 | 0 | 583 |
Year-on-year rate of sales amount
2018年12月期(18期 2018年1月1日~2018年12月31日)
| Month | Year-on-year rate of sales amount(%) | |
|---|---|---|
| All stores | Existing stores | |
| Jan, 2018 | 136.4% | 109.1% |
| Feb, 2018 | 141.0% | 115.8% |
| Mar, 2018 | 137.2% | 113.4% |
| Apr, 2018 | 104.0% | 87.4% |
| May, 2018 | 131.4% | 112.1% |
| June, 2018 | 136.5% | 115.0% |
| July, 2018 | 115.9% | 97.9% |
| Aug, 2018 | 102.3% | 87.9% |
| Sept, 2018 | 130.7% | 111.6% |
| Oct, 2018 | 82.3% | 71.3% |
| Nov, 2018 | 100.3% | 87.8% |
| Dec, 2018 | 127.9% | 114.0% |
* The rate for existing stores is calculated for stores that have been open for 13 months or longer. The number of the target stores may vary.
* The above figures are based on data on stores in all areas. Differences due to sales campaigns and weather conditions in different prefectures are not considered.
The above values are subject to change without prior notice. Our company bears no responsibility for any such change.
* The number in parentheses "( )" in the Relocation column is the number of stores that were closed due to relocation.